When Was the Golden Age of American K-12 Education? And How Can We Tell?
Petrilli: A look at NAEP scores — and the students who took those tests — provides insights into what works in the classroom and where to go from here

;)
Sharpen Up!
Sign up for our free newsletter and start your day with in-depth reporting on the latest topics in education.
Get stories like these delivered straight to your inbox. Sign up for The 74 Newsletter
Recently, the Washington Post’s (fantastic) “Department of Data” columnist, Andrew Van Dam, ran a fun feature about “America’s best decade,” according to public opinion. Across a wide range of domains, from music to movies, the economy and family life, he dug into what citizens view as America’s Golden Era. Turns out it was almost always during their childhood or teenage years.
The survey didn’t ask about schools, which is too bad. But it made me wonder: When was the Golden Age of American K-12 education? The answers might provide hints about smart policies and practices for the years to come, especially as the nation continues to dig out from the COVID debacle.
The key question is which indicators to examine. Some might point to high school graduation rates, given that educational attainment is a traditional measure of school quality. But I’m skeptical; it’s a notoriously squishy metric, since the easiest way to boost graduation rates is to lower standards — surely a major reason why grad rates are at an all-time high.
A stronger indicator might be postsecondary completion; no doubt one of the key goals of K-12 education is to prepare students to succeed in college. But there are issues with that metric, too. Colleges can inflate graduation rates by lowering standards. Plus, there’s the newfound recognition that not everyone should go, making a focus on postsecondary education feel a bit anachronistic.
But let’s look at it anyway. These data come from the Census Bureau’s Current Population Survey, which asked a random sample of adults ages 25 to 29 about their educational attainment. If we want to use this as a measure of the K-12 system’s effectiveness, it’s important to remember that there’s a seven- to 11-year lag between high school graduation and the reporting of the data. To make the charts easier to understand, I’ll show the years these young adults graduated from high school. (API stands for Asian and Pacific Islanders.)
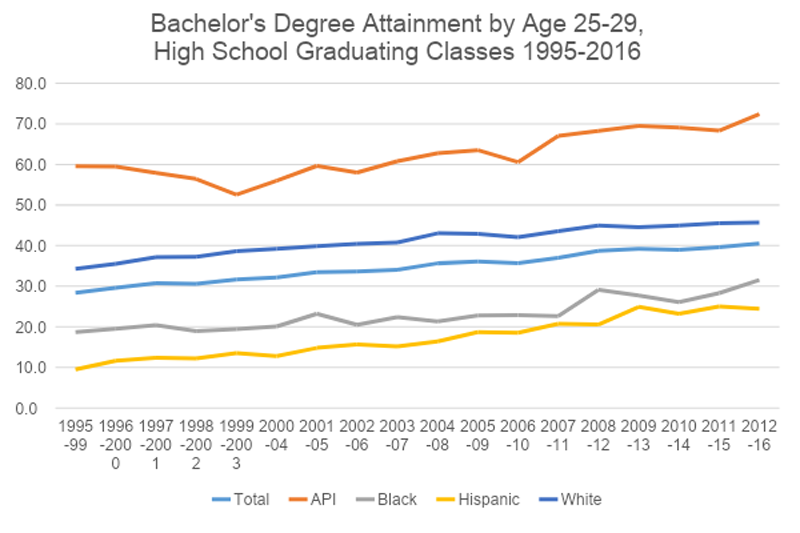
As with high school graduation rates, college attainment is up, up and up, climbing from 28% of Americans who graduated from high school in the late 1990s to 41% in the mid-2010s. Note especially the tremendous progress for Hispanic students, whose college attainment rate rose 157% over this period, and for Black students, whose rate grew 68%.
Because of the time lag, there is no data for students who graduated after 2016, including the COVID cohorts. So by this measure, the heyday of American education appears to have been in the early- to mid-2010s, and possibly even more recently.
Student achievement
The other obvious way to identify the Golden Era of American Education is to look at the high point of student achievement. This is harder, if not impossible, to game — but there are issues here, too, especially with scores for 17-year-olds/12th graders. According to the National Assessment of Educational Progress’s Long Term Trends series, scores for 17-year-olds peaked in the late 1980s or early 1990s in reading and in 1999 in math. Meanwhile, on the main NAEP, which has been adjusted over the decades to better align with curricular changes but goes back only to the early 1990s, 12th graders hit their peak in 1992 in reading (the math trend goes back only to 2005, so it isn’t much use)
But because high school graduation rates have increased so dramatically over the decades — from 73% in 1990 to 86% in 2023 — I find the achievement trends for older students unreliable. It seems highly likely that low-performing students who today make it to graduation (and thus sit for the NAEP exams), but back then would have dropped out, are lowering recent achievement results.
So that leaves scores for 9-year-olds and 13-year-olds (on the LTT) and fourth- and eighth-graders (on the main NAEP).
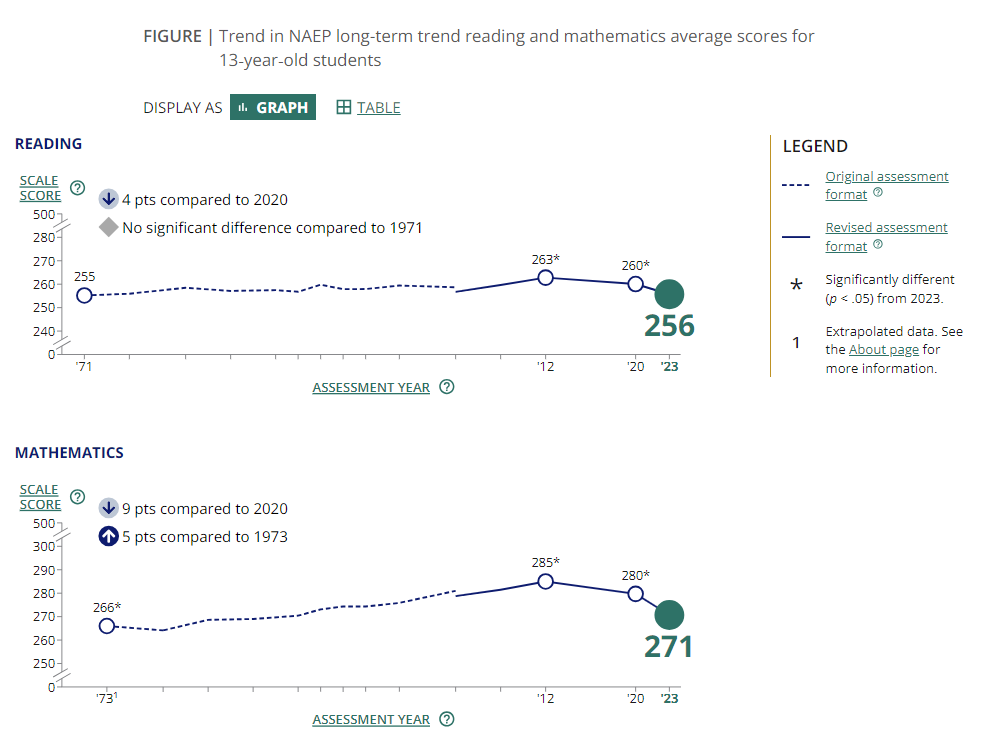
According to the LTT, students hit their peak in 2012, both in reading and math and for 9-year-olds and 13-year-olds. (Granted, the reading trends, especially for 13-year-olds, were pretty darn flat, so “high point” might be an exaggeration.) Scores were trending down even before the pandemic, when they fell off a cliff.

Meanwhile, on the main NAEP, students hit the high point in 2013 or 2015, depending on grade and subject area, before entering a pre-COVID decline.
Meanwhile, on the main NAEP, students hit the high point in 2013 or 2015, depending on grade and subject area, before entering a pre-COVID decline.
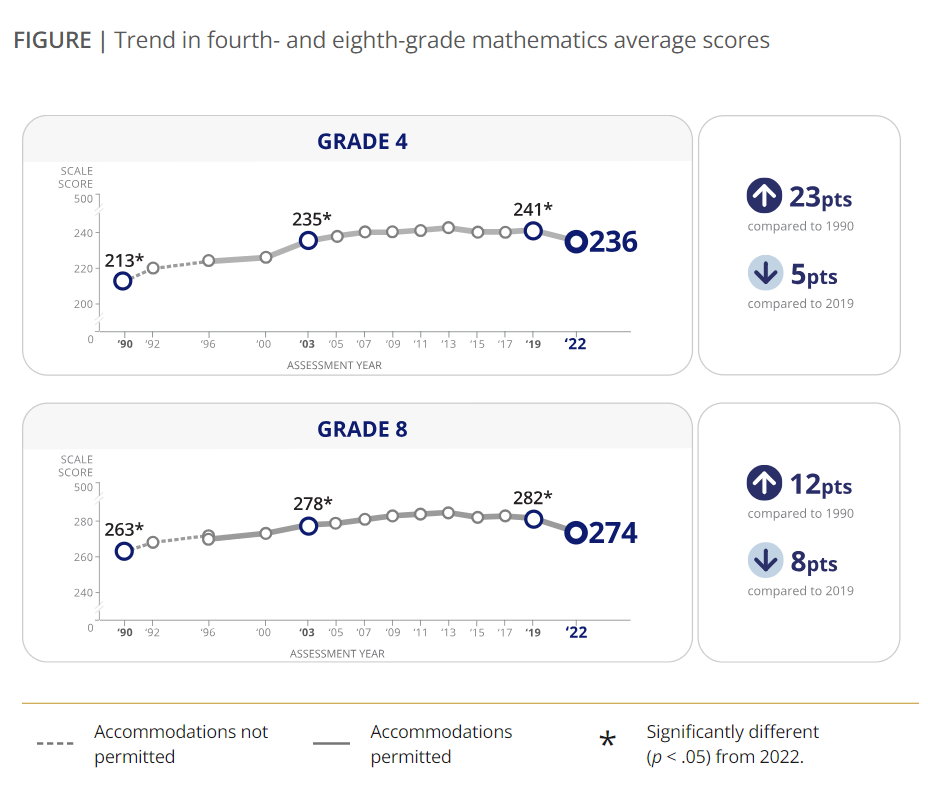
So according to achievement scores, education’s Golden Era was in the early to mid-2010s.
But is that the right answer? It’s certainly when American students performed their best, both on test scores and in terms of college attainment. The adults who were in school back then — the youngest Millennials and oldest Gen-Zers, or what some call Zennials — might be considered the Smartest Generation.
Measuring school effectiveness
But I want to know when the education system was at its best. For that, we can do better than raw test score averages. That’s for a couple of reasons. First, there is the composition of the student population. Think of the mistake some analysts made back in the Nation at Risk era, when they pointed to falling SAT verbal scores as proof that America’s education system was in rapid decline. They failed to note that the population taking the SAT was changing rapidly. Whereas it used to be just elite students taking the college entrance exam, more middle-class and even working-class kids did as well. Not surprisingly, they performed worse on the test and lowered the average scores.
That’s why the NAEP, for as long as it has existed, has been a better measure of student performance than the SAT (or ACT), given that it tests a representative sample. That addresses the selection effects problem, but doesn’t tackle the compositional effects problem — at least, not entirely. With a rapidly changing student population, as we’ve had in recent decades, average scores can mislead.
In particular, the growing number of Hispanic students entering American schools every year — who tend to come from families with lower educational opportunity, and thus score lower on average — will automatically reduce the average test scores of the nation as a whole. Especially given that so many of these new students are still learning English. Indeed, the new federal Condition of Education report finds that the number of students classified as English learners rose by more than a million from 2011 to 2021. If we’re trying to gauge school performance, we have to control for such changes.
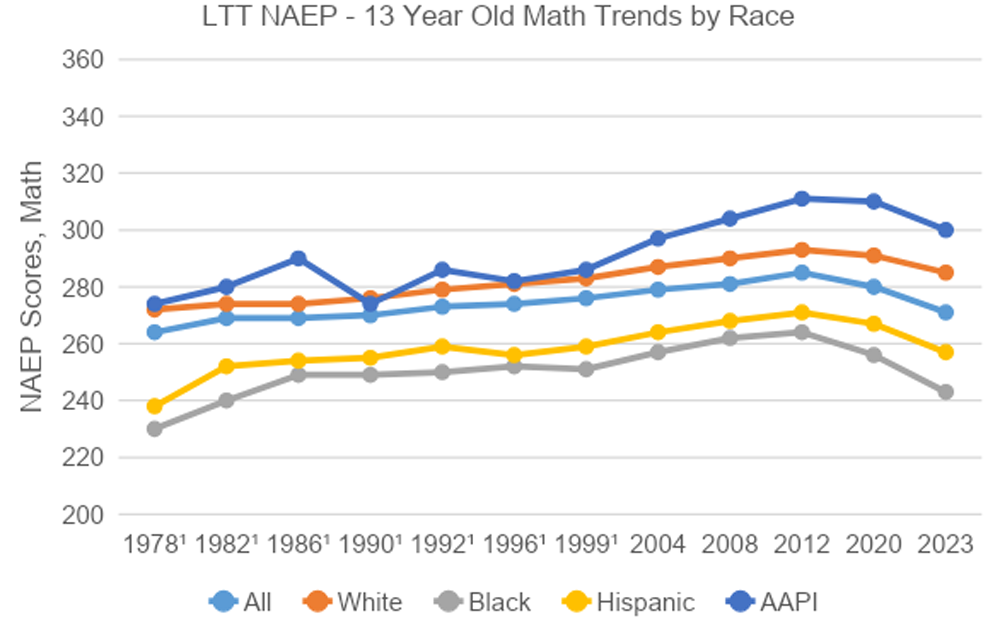
One straightforward way to do so is to look at trends in student achievement for individual racial/ethnic groups. This doesn’t alter the picture much for math; the trend lines for the major subgroups track that national average pretty well, with all generally increasing until the 2010s. Here’s what that looks like for the Long Term Trend assessment for 13-year-olds:
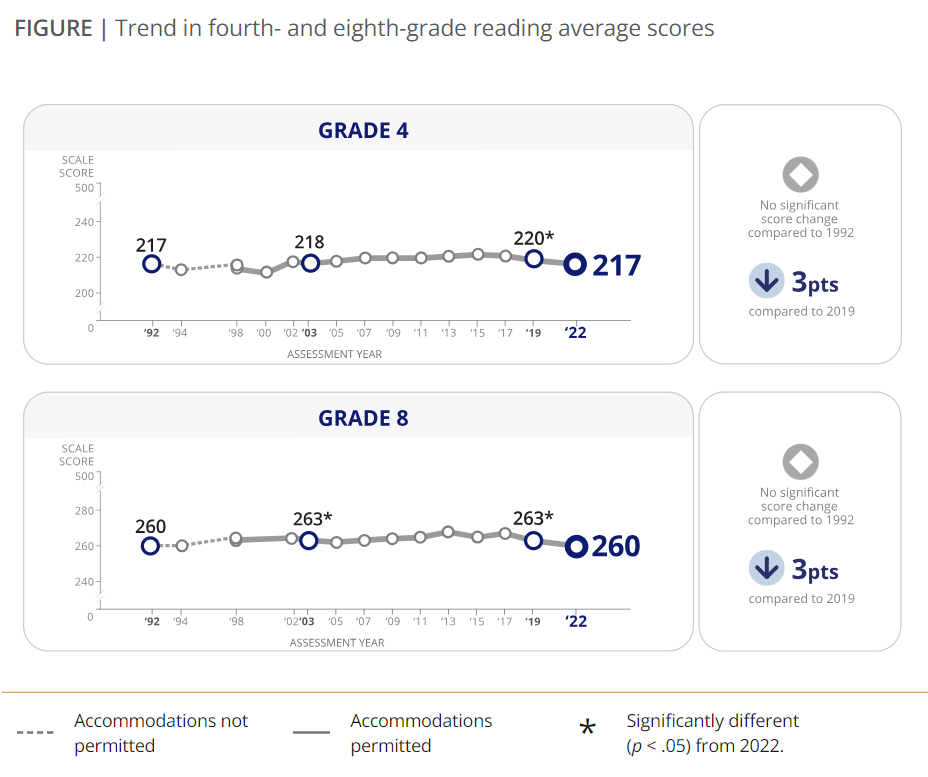
But in reading, there were periods when all or most of the major racial groups were making progress, even though the national average looked flat. From 2002 until 2019, for example, fourth-graders’ average reading scores barely budged, ticking up just a single point. But both Black and Hispanic students made significant gains, with increases of 5 and 8 points, respectively. That progress remained hidden within the national averages, largely because the Hispanic population share was also growing rapidly at the same time.
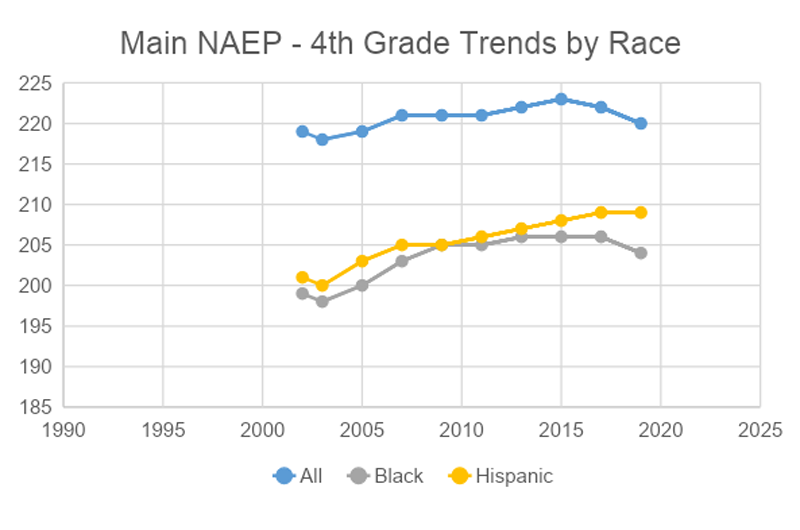
So when we analysts reported that, pre-COVID, American reading scores were flat as a pancake, we weren’t wrong — but that wasn’t the full story. Schools were doing something to boost reading performance over time, at least for Black and Hispanic students, albeit more slowly than the country would have liked.
Cohort growth
It’s also important to consider what might be changing in American society. That’s because test scores correlate highly with family background, and those backgrounds have changed a lot over time. Child poverty rates have gone up and (mostly) down; the number of two-parent families has declined; nutrition has improved; environmental risks (like lead paint) have decreased. All these factors affect test scores.
Most importantly, what happens to kids in the years before they sit for a test — especially before they even enter school — has a big impact on their achievement. Yet, there’s no good trend line for student performance before age 9 (for the LTT) or fourth grade (main NAEP). I’ve called for the federal government to start testing students in kindergarten to partially correct for this, so we would at least get a good read on whether students are coming into schools better or worse prepared than in the past. We could then use those kindergarten scores as controls to better isolate the performance of schools versus everything else going on in society. (By one metric — the Northwest Evaluation Association’s Measures of Academic Progress test — student readiness started to fall in the early 2010s, which might partially explain the pre-COVID slump.)
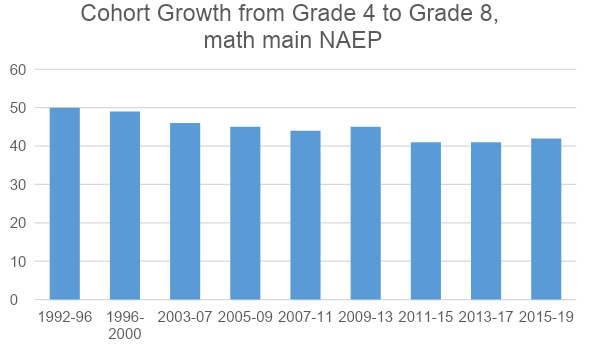
In the meantime, we can apply the same logic by using fourth-grade scores as controls. In other words, looking at the changes in test scores for the same group of students as they move from fourth to eighth grade can give a rough estimate of school performance, at least in the upper elementary and middle school grades. This cohort growth measure has become popular among some analysts, including Matt Chingos at the Urban Institute, and for good reason. (Unfortunately, LTT doesn’t work for a similar analysis because its testing schedule has been too irregular. Likewise with grade 12 trends on the main NAEP.)
We’ll focus here on math, given that progress in reading has been so slight, and see when cohort growth was the strongest. This provides a very different answer: The mid- to late-1990s were the heyday of American education. Indeed, whereas achievement kept improving until the early to mid-2010s, the trend for cohort growth is generally downward.
Though not shown here, the cohort patterns look largely the same when disaggregated by race and percentile level, though the mid-2010s slump was particularly bad for the lowest-achieving kids and for Black students — as was the COVID era.
Summing it up
So where does that leave us?
- Student achievement reached its all-time high in the early to mid-2010s, before slumping through the rest of the decade and then falling off a cliff during COVID. College attainment was also highest for students who graduated high school in the early to mid-2010s, though it might have kept rising afterward. The young Americans who were in school in the early to mid-2010s, then, might be considered our Smartest Generation.
- Gains in math have been particularly impressive over the years, at least until the 2010s — though schools performed somewhat better in reading than national averages indicate, given the rapidly changing composition of the student population, especially the dramatic rise in (lower-scoring) Hispanic students and English learners.
- However, schools’ productivity — in terms of boosting students’ test scores from grades 4 to 8 — peaked much sooner, in the mid to late 1990s, before declining somewhat in the 2000s and even more in the 2010s. The mid to late 1990s, then, might be considered American Education’s heyday.
The late 1990s were indeed a Golden Age, when the Cold War was over (and the war on terrorism hadn’t started), the economy was booming, child poverty was falling and the combination of increased school spending and consequential accountability were marching across the land. (No, those weren’t my childhood or teenage years, but it was the time when I was lucky to join the nascent education reform movement.)
As an eternal optimist, I must remain hopeful that another Golden Age might be right around the corner. I know, COVID learning loss was massive, and kids are still entering school behind where they used to be. And educators are struggling mightily with a student engagement crisis, with chronic absenteeism, misbehavior and phone addiction creating daily challenges.
But at the same time, many states and districts have been investing in high-dosage tutoring, getting their act together when it comes to the Science of Reading and adopting (if not fully implementing) high-quality instructional materials. A strong economy is keeping child poverty rates low, too. All these factors should help kids make progress in the years ahead — especially if policymakers decide to bring back a measure of accountability as well.
If we analysts focus on cohort growth rather than raw trend lines, Americans might spot a rebound sooner than many naysayers expect.
Special thanks to Fordham senior research associate Meredith Coffey for the extensive data analysis represented here.
Get stories like these delivered straight to your inbox. Sign up for The 74 Newsletter
Michael J. Petrilli is president of the Thomas B. Fordham Institute, a visiting fellow at Stanford University's Hoover Institution.